
Top 10 Data Analyst Interview Questions to Master in 2026 (Australia)

Landing a top data analyst role in Australia's competitive market requires more than just technical skill. It demands strategic preparation, clear communication, and the ability to demonstrate real-world business impact. As the demand for data professionals grows in hubs like Sydney, Melbourne, and Brisbane, hiring managers are looking for candidates who can not only write complex SQL queries but also translate data into actionable strategy.
This guide breaks down the essential data analyst interview questions you'll face in 2026. We provide model answer frameworks, expert tips, and specific advice tailored to the Australian hiring context. From fundamental statistical concepts to complex behavioural scenarios, mastering these questions will prepare you to showcase your value and secure your next role.
You will learn how to:
Structure your answers to demonstrate both technical and business acumen.
Approach common tasks like exploratory data analysis (EDA) and A/B testing.
Handle questions about missing data, outliers, and validating insights.
Communicate the impact of your work using effective data visualisation techniques.
Whether you're a junior analyst starting your journey or a senior professional aiming for a leadership position, this list will give you the confidence to turn your interview into a job offer. For those specifically looking for opportunities, platforms like AI Jobs Australia are invaluable for finding curated AI-focused data analyst roles across the country. We will cover a range of questions, from walking through a project to writing specific SQL queries, ensuring you are prepared for every stage of the interview process.
1. Walk me through your approach to exploratory data analysis (EDA)
This question is a cornerstone of data analyst interview questions because it reveals your structured thinking and foundational skills. Interviewers want to see that you have a methodical process for getting to know a dataset before drawing any conclusions. A strong answer demonstrates how you systematically uncover patterns, spot anomalies, test assumptions, and validate data quality.
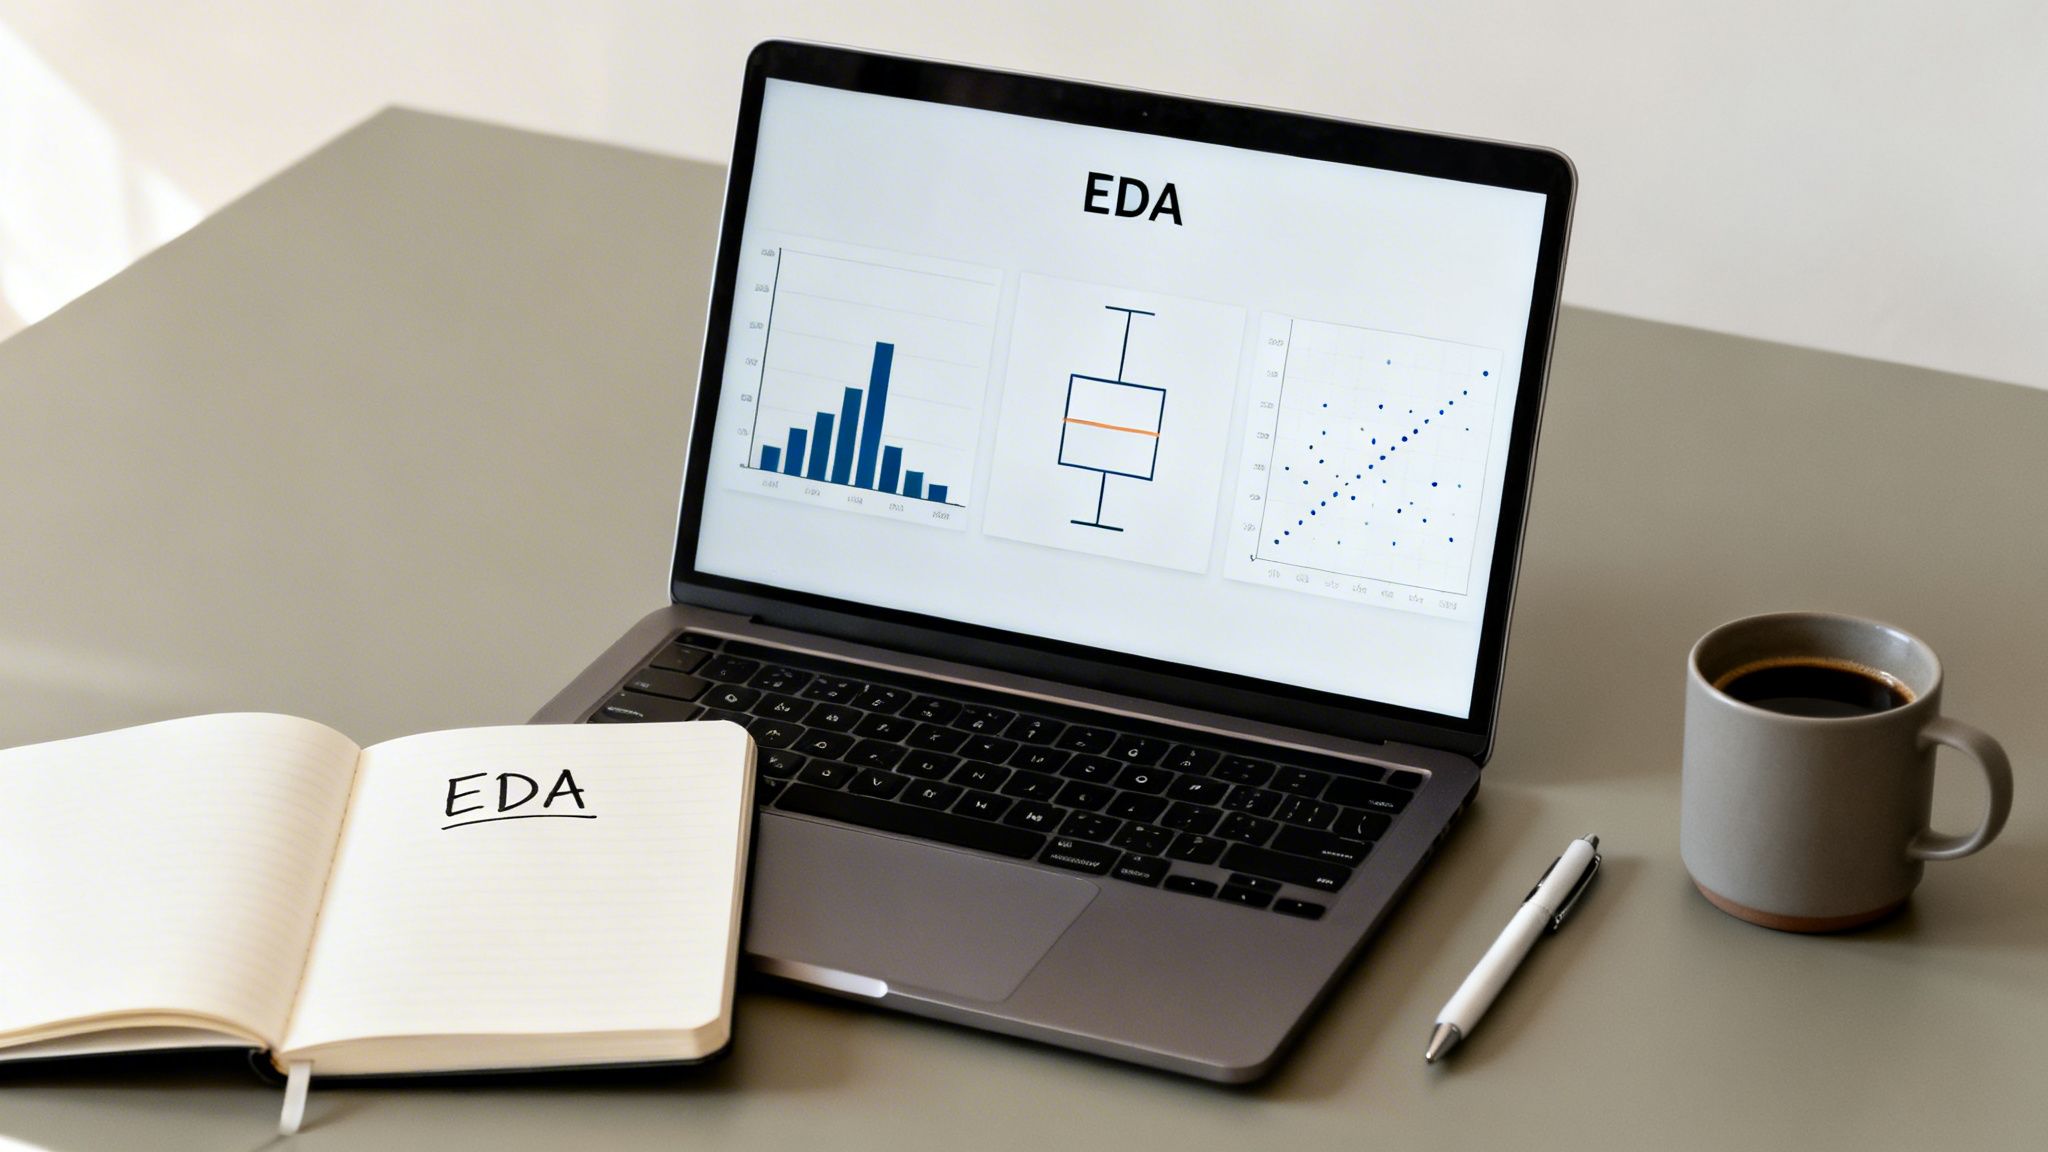
This initial exploration, popularised by statistician John Tukey, is critical. It ensures that the insights you eventually deliver are based on a solid understanding of the data's character and limitations. For Australian roles, where data can come from diverse sectors like banking (e.g., ANZ), retail, or government, showcasing a robust EDA framework is especially important. This is one of the core skills that separates a data analyst from a data scientist, as the former often focuses on extracting immediate business value from existing data. For a deeper dive into these roles, you can explore the distinctions between a data analyst vs. data scientist in Australia.
How to Structure Your Answer
Frame your response as a step-by-step process. This shows the interviewer you are organised and deliberate in your work.
1. Define Objectives & Ask Questions: Start by stating the business goal. For a customer churn dataset, the objective is to understand what drives customers to leave. I'd ask initial questions like, "What is the timeframe of this data?" or "What defines 'churn'?"
2. Data Quality & Cleaning: My first hands-on step is to assess data integrity. This involves using tools like Python's
pandaslibrary to check for missing values (.isnull().sum()), duplicates (.duplicated().sum()), and incorrect data types (.dtypes).3. Univariate Analysis: Next, I examine individual variables to understand their distributions. I use histograms for numerical data (e.g., customer tenure) and bar charts for categorical data (e.g., subscription type). This helps identify skewness and outliers.
4. Bivariate & Multivariate Analysis: I then explore relationships between variables. I'd use scatter plots to check correlations between two numerical variables or box plots to compare a numerical variable across different categories. A heatmap is excellent for visualising correlations across many variables at once.
5. Document & Communicate: Finally, I summarise my findings in a clear, accessible way. I highlight key patterns, document any data quality issues I resolved, and propose hypotheses for further analysis or modelling.
2. Explain the difference between correlation and causation with a real-world example
This is one of the most fundamental data analyst interview questions, testing your statistical literacy and critical thinking. Interviewers ask this to ensure you won't make the costly mistake of assuming one factor causes another just because they move together. A strong answer proves you can interpret data responsibly and communicate potential analytical traps to non-technical stakeholders.
Mistaking correlation for causation can lead to poor business decisions. For example, a retail company in Australia might notice a correlation between increased marketing spend in a region and higher sales, but a robust analysis is needed to prove the spend caused the increase, rather than just coinciding with a local economic boom. This concept, popularised by figures like Edward Tufte and Judea Pearl, is central to analytical integrity.
How to Structure Your Answer
A clear, example-driven response is key. Show the interviewer you not only know the definition but can apply it to a business context.
1. Start with a Clear Definition: Begin by defining both terms. Correlation is a statistical measure that indicates the extent to which two variables fluctuate together. Causation means that a change in one variable directly produces a change in another. The key takeaway is: correlation does not imply causation.
2. Provide a Classic Example: Use a memorable, easy-to-understand example. For instance, ice cream sales and drowning incidents are highly correlated; they both increase during summer. However, buying ice cream does not cause drowning. The confounding variable is temperature; hotter weather causes people to both buy more ice cream and swim more often.
3. Relate it to a Business Context: Translate the concept into a business scenario. "At a previous role, we saw a correlation between employees who used standing desks and higher productivity. Before investing in desks for everyone, we had to consider if the a 'cause' was simply that more motivated employees were the first to adopt them. The desks didn't cause the productivity, the pre-existing motivation did."
4. Discuss How to Test for Causation: Briefly mention methods used to move from correlation to causation. This demonstrates advanced analytical knowledge. I would talk about the importance of A/B testing (randomised controlled trials) as the gold standard. I might also mention quasi-experimental methods like regression discontinuity or difference-in-differences analysis for situations where A/B testing isn't feasible.
3. How would you handle missing data in a dataset? Describe your decision-making process.
This is one of the most practical data analyst interview questions because nearly every real-world dataset is imperfect. Your answer reveals your problem-solving skills, statistical awareness, and ability to make decisions based on context. Interviewers are looking for a thoughtful, structured process, not a one-size-fits-all answer like "I'd just delete the rows."

How you address missing data directly impacts the validity of your analysis and any subsequent models. For Australian organisations in sectors like healthcare or finance, mishandling missing data can have serious compliance and business implications. Demonstrating a nuanced understanding, popularised by the work of Donald Rubin on missing data theory, shows maturity and technical depth. A candidate who can discuss the trade-offs between different imputation methods is highly valuable.
How to Structure Your Answer
Frame your response as a diagnostic workflow. This shows you don’t apply techniques blindly but instead investigate the problem before selecting a solution.
1. Investigate and Quantify: My first step is to understand the extent and nature of the missingness. I'd use Python's
pandasandmissingnolibraries to visualise the patterns. Key questions are: What percentage of data is missing for each variable? Is the missingness concentrated in specific rows or columns? Is there a correlation between missing values in different columns?2. Determine the Missingness Mechanism: I'd then form a hypothesis about why the data is missing. Is it Missing Completely At Random (MCAR), where there's no systematic reason? Is it Missing At Random (MAR), where the missingness can be explained by other observed variables? Or is it Missing Not At Random (MNAR), where the reason for missingness is related to the missing value itself (e.g., people with high incomes are less likely to disclose it)? The mechanism dictates the appropriate strategy.
3. Select a Strategy Based on Context and Trade-offs: Based on my investigation, I'd choose an approach:
Deletion: If the percentage is very small (<5%) and appears to be MCAR, listwise or pairwise deletion might be acceptable.
Simple Imputation: For numerical data that's MCAR, I might use mean or median imputation. For time-series data, a forward-fill or backward-fill could be appropriate.
Advanced Imputation: If the data is MAR, more advanced methods like K-Nearest Neighbors (KNN) imputation or Multiple Imputation by Chained Equations (MICE) are better as they use information from other variables to make an informed guess.
4. Document and Test: Finally, I would document the chosen method and the reasoning behind it for reproducibility. I would also perform a sensitivity analysis, running my main analysis with and without the imputed data (or with different imputation methods) to see how much my conclusions depend on the imputation choice.
4. Describe a time you discovered an unexpected insight in data. How did you validate it?
This behavioural question is a favourite in data analyst interviews because it tests your curiosity, critical thinking, and scientific rigour. An interviewer wants to know if you can move beyond simple reporting to uncover genuine, actionable insights. They are evaluating your ability to distinguish a true signal from statistical noise and how you validate findings before presenting them as fact.
Your response reveals your entire analytical process in a real-world context. This is more than just technical skill; it shows your business acumen and communication style. In the Australian market, where organisations like Deloitte Australia and ABC News have a strong culture of data-driven storytelling, demonstrating your ability to find and validate a compelling narrative is a significant advantage. It proves you can be trusted to handle ambiguous data and deliver reliable conclusions.
How to Structure Your Answer
Use the STAR method (Situation, Task, Action, Result) to create a clear and compelling story. This framework ensures you cover all the key points the interviewer is looking for.
1. Situation: Briefly set the scene. Describe the business context and the dataset you were working with. For example, "At my previous role in a retail company, I was analysing customer transaction data from the past year."
2. Task: Explain your objective. What was the goal of your analysis? For instance, "My task was to identify key drivers of customer loyalty and repeat purchases to inform a new marketing campaign."
3. Action: This is the core of your answer. Detail the steps you took, the unexpected finding, and your validation process. For example, "While analysing purchase frequency, I noticed a segment of high-value customers who made zero purchases in the last quarter, which was completely unexpected. My initial thought was a data entry error. To validate, I first checked the data pipeline for recent changes, then cross-referenced customer IDs with our CRM system. Finally, I realised the aggregate trend was misleading; segmenting by geographic region showed this drop-off was concentrated entirely in metro areas, a classic case of Simpson's Paradox."
4. Result: Conclude by explaining the impact of your insight. What changed because of your work? "My validated finding showed that a recent competitor marketing campaign in metro areas was far more effective than we realised. This led the marketing team to redirect their budget towards a counter-campaign in those specific cities, which helped recover a significant portion of the at-risk customer base in the following quarter."
5. What SQL query would you write to find the top 5 customers by total spending, excluding returns?
This is a classic technical question among data analyst interview questions, designed to directly test your SQL proficiency. Interviewers use it to assess not just your ability to write a functional query, but also your grasp of business logic, query structure, and efficiency. A great answer shows you can translate a business requirement into clean, performant SQL.
This kind of question is highly relevant in the Australian market, where companies like Commonwealth Bank, Westpac, and major retailers handle enormous transaction datasets. Your ability to filter out noise (like returns), aggregate data accurately, and deliver a clear result is fundamental. It demonstrates practical skills needed to derive value from large-scale commercial or financial data.
How to Structure Your Answer
Frame your response by first clarifying the requirements, then building the query step-by-step, and finally discussing optimisations and verification.
1. Clarify Requirements & Assumptions: Before writing any code, I would ask clarifying questions. For example: "What is the time period for this analysis?" "How are returns identified in the data, e.g., a specific
transaction_typeor negative amounts?" and "Do we need customer names or just IDs?" This shows you think before you code.2. Write the Core Query: My initial approach would be a clear, straightforward query. I'd join the
customersandtransactionstables, filter out the returns, group by the customer, and then order the results to find the top 5. Using aliases and clear indentation is key for readability.SELECT
c.customer_id,
c.customer_name,
SUM(t.amount) AS total_spending
FROM
customers c
JOIN
transactions t ON c.customer_id = t.customer_id
WHERE
t.transaction_type != 'return' -- Assuming returns are marked this way
GROUP BY
c.customer_id, c.customer_name
ORDER BY
total_spending DESC
LIMIT 5;3. Discuss Enhancements & Edge Cases: A senior candidate would then discuss improvements. I might suggest using a Common Table Expression (CTE) to make the logic cleaner, especially if the filtering is complex. I'd also mention handling potential
NULLvalues in the amount column usingCOALESCE(t.amount, 0)and considering performance by ensuringcustomer_idis indexed.4. Explain Verification & Alternatives: Finally, I would explain how to validate the query's output. This includes spot-checking a specific customer's transactions manually and comparing the total sum against a known grand total. I'd also mention alternative approaches, like using window functions (
RANK()orDENSE_RANK()) if we needed to handle ties in spending, and explain the trade-offs.
6. How do you approach A/B testing? What metrics would you track and why?
This is a critical entry in our list of data analyst interview questions, as it assesses your grasp of experimental design, statistical rigour, and business impact. Interviewers want to know if you can design, execute, and interpret an experiment that delivers clear, actionable results. A strong answer shows you think about the entire lifecycle of an A/B test, not just the p-value.
Companies like Atlassian, Canva, and Seek have cultivated strong experimentation cultures, making this a highly relevant skill for roles in Australia’s tech and e-commerce sectors. Your ability to frame a business problem as a testable hypothesis is a key differentiator. The principles of A/B testing, popularised by figures like Ron Kohavi at Microsoft, are foundational to data-driven decision-making.
How to Structure Your Answer
A methodical, step-by-step response demonstrates your structured approach to experimentation. Show the interviewer you have a playbook for running reliable tests.
1. Formulate a Clear Hypothesis: Start with the business goal and translate it into a specific, testable hypothesis. For example, "By changing the checkout button colour from blue to green, we will increase the click-through rate because the new colour has higher contrast, leading to a 2% lift in checkout completions."
2. Define Primary & Secondary Metrics: Identify a single primary metric directly linked to the hypothesis (e.g., conversion rate). Then, select several secondary (or guardrail) metrics to monitor for unintended consequences. For a checkout page test, secondary metrics could include average order value, cart abandonment rate, or page load time.
3. Determine Sample Size & Duration: Explain how you would perform a power analysis to calculate the required sample size. This involves defining the desired statistical power (usually 80%), significance level (alpha, typically 5%), and the Minimum Detectable Effect (MDE). This calculation determines how long the test needs to run to achieve a statistically significant result.
4. Execution & Monitoring: Describe the technical setup and the importance of avoiding common pitfalls. I would ensure random and unbiased user assignment into control (A) and variant (B) groups. It is also crucial to avoid "peeking" at results prematurely, as this can lead to false conclusions.
5. Analyse & Communicate Results: Once the test concludes, analyse the results using appropriate statistical tests (e.g., chi-squared test for conversion rates). I would then present the findings clearly, stating whether the hypothesis was validated and providing a recommendation. The report should include the primary metric's performance, changes in secondary metrics, and confidence intervals. For Australian financial product tests, I would also note adherence to any relevant ASIC compliance standards.
7. Walk me through how you'd analyze a dataset you've never seen before. What's your first step?
This question expands on the EDA process by testing your ability to work under uncertainty. Hiring managers want to see if you can apply a systematic method to an unknown dataset, demonstrating curiosity, problem-solving skills, and the ability to ask the right questions before diving into the technical work. It’s one of the most common data analyst interview questions because it simulates a real-world scenario where an analyst is given new data and a vague business problem.
A strong answer reveals your independence and structured thinking. Australian employers at companies like Telstra or Westpac, who handle vast and varied datasets, particularly value analysts who can confidently navigate unfamiliar data sources. Your ability to start with context-seeking questions before writing a single line of code shows maturity and a focus on business value, which is a critical trait for a successful analyst.
How to Structure Your Answer
Frame your response as a pragmatic, sequential workflow. This proves you have a reliable methodology that can be applied to any analytical challenge.
1. Start with "Why": Clarify Business Context. My absolute first step is not to touch the data, but to understand the objective. I would ask clarifying questions like, "What is the business problem we are trying to solve?" or "What decisions will this analysis inform?" For a retail transaction dataset, the goal might be to understand sales trends, while for a government health dataset, it might be to identify at-risk populations.
2. Initial Data Loading & Profiling: Once I have the context, I load the data using Python's
pandasor an equivalent tool. I perform an initial high-level profiling to get a feel for its structure. This involves checking its dimensions (.shape), reviewing the first few rows (.head()), and getting a summary of data types and non-null counts (.info()).3. Conduct a Data Quality Audit: My next step is a focused check on data integrity. I'll look for missing values, duplicates, and obvious inconsistencies. For example, in Australian customer data, I'd validate that postcodes match state abbreviations or that currency fields are consistent. I would document these issues and decide whether to clean, impute, or exclude problematic data, communicating my decisions.
4. Perform Exploratory Data Analysis (EDA): With a cleaner dataset, I begin exploring. I'd start with univariate analysis (histograms, bar charts) to understand individual variable distributions, then move to bivariate analysis (scatter plots, box plots) to uncover initial relationships and correlations relevant to the business goal.
5. Communicate & Iterate: Throughout this process, I document my assumptions, cleaning steps, and initial findings. I would provide a preliminary summary to stakeholders before getting too deep into the analysis. This ensures alignment and allows for feedback, making the process iterative and preventing wasted effort on incorrect assumptions.
8. Explain how you would identify and handle outliers in a dataset
This is one of the classic technical data analyst interview questions that probes your statistical knowledge and, more importantly, your business judgment. Interviewers want to know if you blindly remove data points or if you investigate their context first. A strong response demonstrates a methodical approach to identifying, understanding, and making a reasoned decision about these unusual data points.
The handling of outliers is critical across many Australian industries. In finance, an outlier could be a fraudulent transaction or a major institutional trade. In healthcare, it might signify a rare disease, a data entry mistake, or a critical patient outcome. Your ability to distinguish between these scenarios shows you can protect the integrity of your analysis and deliver reliable insights. The concept was formalised in the field of robust statistics, notably by John Tukey, who also championed exploratory data analysis.
How to Structure Your Answer
Frame your answer as a process that moves from statistical detection to contextual investigation and finally to a documented action. This shows you are thorough and thoughtful.
1. Define & Detect: I would first define what constitutes an outlier in the context of the business problem. Statistically, I can identify them using methods like the Interquartile Range (IQR) or Z-scores (points more than 3 standard deviations from the mean). Visual tools like box plots and scatter plots are excellent for initial detection. For more complex datasets, I might use an algorithm like an Isolation Forest.
2. Investigate the Root Cause: This is the most critical step. I don't automatically remove outliers. Instead, I investigate why they exist. Is it a data entry error? A system glitch? Or is it a genuine, albeit rare, event? For example, a retail customer with 100x the average spend could be a data error, or they could be a legitimate VIP customer who needs to be analysed separately.
3. Analyse the Impact: I would assess how the outliers affect the overall dataset and my planned analysis. For instance, outliers can heavily skew the mean but have little effect on the median. They can also disproportionately influence the coefficients of a linear regression model.
4. Decide on a Handling Strategy: Based on the investigation, I have several options:
Remove: If it's a confirmed error (e.g., a customer age of 200).
Transform: Apply a mathematical transformation (like a log transformation) to reduce the skewness caused by the outlier.
Keep: If the outlier is genuine and important for the analysis (e.g., a major market crash in financial data).
Analyse Separately: Sometimes it's best to segment the data and analyse the outlier group on its own.
5. Document Everything: Finally, I would transparently document which data points I identified as outliers, the rationale behind my handling decision, and the method I used. This ensures the analysis is reproducible and the results are credible.
9. Tell me about a situation where your analysis led to actionable insights. What was the impact?
This behavioural question is designed to separate analysts who simply report on data from those who drive business outcomes. It's one of the most critical data analyst interview questions because it assesses your ability to connect technical work to tangible value. Employers want to see that you can translate complex findings into a clear story that persuades stakeholders to act.
This question tests your entire analytical workflow, from understanding the business problem to measuring the final result. For Australian companies in sectors like e-commerce, finance, or logistics, demonstrating how your analysis led to a specific, quantifiable improvement-such as increased revenue or reduced costs-is a powerful way to prove your commercial acumen and impact.
How to Structure Your Answer
The STAR method (Situation, Task, Action, Result) is the perfect framework for this question. It provides a clear, logical narrative that highlights your contribution and its effect.
1. Situation: Briefly set the scene. Describe the business context and the problem or opportunity you faced. For example, "At my previous retail company, we noticed a decline in repeat purchases from our online customers, but we didn't understand the cause."
2. Task: Explain your specific objective. What were you asked to do? "My task was to analyse the customer journey and purchase history data to identify the key factors contributing to lower customer retention and propose a data-informed solution."
3. Action: Detail the steps you took. This is where you describe your analytical process. "I used SQL to pull transaction and web analytics data, then used Python to segment customers into cohorts based on their first purchase date. I performed a churn analysis that revealed customers who didn't make a second purchase within 45 days were highly unlikely to ever return. My analysis pinpointed a drop-off after the initial welcome discount expired."
4. Result: Quantify the impact of your work. This is the most important part. "I presented these findings to the marketing team and recommended a targeted email campaign offering a modest, personalised discount to customers approaching the 45-day mark. The A/B test of this campaign resulted in a 15% increase in repeat purchases from the targeted segment, directly boosting quarterly revenue."
10. Describe your experience with data visualisation. What makes a visualisation effective?
This question probes your ability to translate raw data into a compelling visual story. Interviewers are looking for more than just technical proficiency with charting tools; they want to see if you understand the principles of design, audience awareness, and clear communication. A great answer shows you can create visuals that are not only accurate but also insightful and immediately understandable to stakeholders.

Effective data visualisation is a core competency for any data analyst, especially in Australian business contexts where decisions are data-driven across diverse sectors. The ability to present complex findings to a non-technical executive team is just as important as the analysis itself. Pioneers like Edward Tufte and Cole Nussbaumer Knaflic have established principles that focus on clarity and narrative, moving beyond simple chart creation to genuine data storytelling. Your answer should reflect an understanding of these deeper concepts.
How to Structure Your Answer
A strong response combines principles, process, and practical examples. Frame your answer around the journey from raw data to a finished, impactful visual.
1. Start with the "Why" and the Audience: First, I always clarify the goal and the audience. Is this for a technical deep-dive or an executive summary? A dashboard for a marketing manager needs different information and a different level of detail than a chart for a fellow analyst.
2. Select the Right Chart Type: Based on the objective, I choose the appropriate chart. I use line charts for trends over time, bar charts for comparing categories, scatter plots for exploring relationships, and heatmaps for identifying patterns across multiple variables. I strictly avoid misleading charts like 3D pie charts.
3. Apply Core Design Principles: My focus is on clarity and accuracy. This means ensuring axes are clearly labelled, using a colour-blind-friendly palette, and removing "chartjunk" like unnecessary gridlines or decorations. The message should be obvious at a glance.
4. Mention Specific Tools: I'm proficient in tools like Tableau for creating interactive dashboards and Python's Matplotlib or Seaborn for exploratory analysis. I choose the tool based on the project's needs for interactivity, customisation, and speed. You can find a great comparison of the best data visualisation tools to see how they fit different scenarios.
5. Emphasise Storytelling and Iteration: Finally, I build a narrative around the data. I use annotations and titles to guide the viewer to the key insight. I also believe in an iterative process, where I seek feedback from stakeholders to refine the visualisation and ensure it effectively answers their business questions.
Comparison of 10 Data Analyst Interview Questions
| Item | Complexity 🔄 | Resource requirements ⚡ | Expected outcomes 📊 | Ideal use cases 💡 | Key advantages ⭐ |
|---|---|---|---|---|---|
| Walk me through your approach to exploratory data analysis (EDA) | Moderate — structured, iterative steps (profiling → visualize → test) | Low–Medium — pandas/R, plotting tools, analyst time | Clear data quality picture, patterns, feature ideas | Early project scoping, model prep, reporting | Detects issues early; informs modeling and stakeholder stories |
| Explain the difference between correlation and causation (with example) | Low — conceptual explanation plus example | Low — statistical understanding and relatable example | Avoids false conclusions; clarifies limitations | Stakeholder communication, interpreting observational studies | Prevents misinformed decisions; shows statistical maturity |
| How would you handle missing data? Describe decision-making | Medium — assessment of missingness mechanism and trade-offs | Medium — imputation libraries, domain input, validation time | Biasedness reduced, preserved sample size, documented approach | Surveys, medical/financial records, messy real-world data | Balances bias vs. variance; reproducible handling strategies |
| Describe a time you discovered an unexpected insight. How did you validate it? | Low–Medium — behavioral + validation steps (tests, peer review) | Low — past example, validation artifacts, stakeholder checks | Validated insight, stakeholder buy-in, actionable next steps | Interviews, showcasing impact, cross-functional projects | Demonstrates curiosity, rigor and communication under uncertainty |
| SQL: top 5 customers by total spending, excluding returns | Low — standard aggregation and filtering | Low — DB access and SQL familiarity | Accurate ranked customer list, handles business logic | Transaction reporting, dashboards, revenue analysis | Practical, verifiable, performance-optimizable |
| How do you approach A/B testing? What metrics would you track? | High — experiment design, power, and monitoring | Medium–High — experimentation platform, traffic, instrumentation | Causal impact estimates, metric-informed decisions | Product changes, UX experiments, pricing tests | Rigorous causal inference; aligns metrics to business goals |
| Analyze a dataset you've never seen before — first step? | Medium — clarifying questions then systematic profiling | Low–Medium — tools + stakeholder input | Prioritised analysis plan, early hypotheses, data issues | Onboarding, ad-hoc analyses, discovery projects | Shows structured thinking and reproducible workflow |
| Identify and handle outliers in a dataset | Medium — multiple detection methods + domain judgment | Low–Medium — detection tools, domain expertise, testing time | Cleaner models, documented decisions, preserved signals | Finance, healthcare, anomaly detection tasks | Preserves meaningful extremes; reduces bias when needed |
| Tell me about a situation where your analysis led to actionable insights | Low–Medium — behavioral + measurable impact | Low — evidence, metrics, stakeholder outcomes | Quantified business impact (revenue, cost, retention) | Performance reviews, interviews, business-case building | Demonstrates influence, ROI and cross-functional collaboration |
| Describe your experience with data visualization. What makes a visualization effective? | Medium — design principles + tooling skills | Low–Medium — visualization tools, iteration time | Clear, accessible visuals that drive decisions | Dashboards, executive reporting, data storytelling | Improves comprehension and decision speed; audience-focused design |
Your Next Move: Turning Preparation into Opportunity
You've now worked through a detailed catalogue of the data analyst interview questions that separate candidates in today's competitive Australian job market. Moving beyond simple memorisation is the key to genuine success. True preparation involves internalising the fundamental principles behind each question, whether it's a technical SQL challenge, a behavioural scenario, or a strategic case study. The goal is to build a mental toolkit, not just a script.
By deconstructing these common questions, you've seen a recurring theme: the 'why' is just as important as the 'what'. An interviewer doesn't just want to know if you can write a GROUP BY clause; they want to understand why you chose it and what business question it answers. They don't just want to hear that you found an insight; they want to know the story of your curiosity, your validation process, and the tangible impact your work delivered.
Solidifying Your Strategy
As you move from reading to practising, focus on structuring your responses with clarity and purpose. A powerful answer isn't just correct, it's compelling.
For Behavioural Questions: Adopt the STAR (Situation, Task, Action, Result) method as your default framework. It forces you to move beyond abstract claims ("I'm a good problem-solver") to concrete evidence ("In a situation where sales were declining, my task was to find the cause. I took the action of analysing customer churn data, and the result was a 15% reduction in attrition after implementing a new retention strategy.").
For Technical Challenges: Always start by clarifying assumptions. Before writing a single line of Python or SQL, ask about the data schema, potential edge cases like null values or returns, and the specific business objective. This demonstrates a thoughtful, meticulous approach that prevents costly errors.
For Case Studies: Consistently link your analysis back to business value. Whether you're discussing A/B testing metrics or an EDA process, frame your actions in the context of improving revenue, cutting costs, enhancing customer experience, or mitigating risk. This shows you're not just a technician; you're a business partner.
Key Insight: The most impressive candidates don't just answer the question asked. They answer the underlying question the interviewer is trying to solve: "Can this person use data to create value for our organisation?"
Tailoring Your Narrative for the Australian Market
Remember that context is crucial. Your preparation should reflect the specific demands of the Australian industries you're targeting. An analyst role at a major bank in Sydney will prioritise risk and compliance, while a position at a Melbourne-based e-commerce startup will focus on customer acquisition and lifetime value. A government role in Canberra will have its own unique priorities centred on public policy and service delivery.
As you rehearse your answers to these data analyst interview questions, adapt your examples to resonate with these local contexts. If you're aiming for the burgeoning AI and machine learning sector, be ready to discuss how your analytical work feeds into model development, feature engineering, or performance monitoring. Your ability to connect your skills to a company's specific mission and the wider Australian economic environment is a powerful differentiator. This journey from preparation to performance is what builds confidence. You've now got the map; it's time to apply it to your unique experience and walk into your next interview ready to demonstrate your true value.
Ready to put your preparation to the test? Finding the right role is the critical next step. Instead of sifting through generic job boards, explore a platform specifically curated for your skills at AI Jobs Australia. It connects talented data professionals with leading Australian companies that are actively seeking expertise in data, AI, and machine learning. Find your next data analyst role on AI Jobs Australia and turn your interview confidence into a career opportunity.